20+ Social Media KPIs Every Marketer Should Track
Discover 21 social media KPIs every marketer should track in 2026, from reach and engagement to ROAS. Learn what to measure and how to improve each.

Social media success always relies on knowing what works for your audience in terms of content format, tone, depth, topical relevance and recency on a particular platform. And that means adopting a data-backed strategy for business growth over posting randomly and hoping for the best.
In this article, let’s look at 20+ social media key performance indicators (KPIs) you can track and some best practices to do it effectively to grow different networks.
Key Takeaways
- Social media KPIs are the metrics that connect posting activity to real business outcomes like traffic and leads.
- Group your KPIs by funnel stage: Awareness (reach, impressions, growth rate), engagement (engagement rate, shares, saves), conversion (CTR, conversion rate, ROAS), and loyalty (repeat engagement, sentiment).
- Advanced KPIs like response time, save/share rate, and post frequency-vs-engagement correlation reveal operational and content gaps.
- The right KPIs always start from a business goal. Pick 3–5 that map to your current objective instead of tracking everything at once.
- Review KPIs on a set cadence (weekly for campaigns, monthly for strategy) so insights actually feed back into your content and budget decisions.
What are Social Media KPIs?
Social media KPIs are the core metrics used to measure whether your social media efforts are driving impact. Tracking social media metrics helps you understand how your social media marketing strategies are contributing to real outcomes, such as traffic, leads, conversions and brand equity.
In other words, social media KPIs are tied directly to your business goals (awareness, engagement, conversions) that help you measure business impact.
17 Essential Social Media Metrics to Track in 2026
We segmented the KPIs based on specific social media marketing goals you may have at the moment. If you are in a hurry, scan the table below to see where to look and how to interpret the metric:
| Goal | Metric | Why It Matters | How to Improve |
Brand Awareness | Reach | Measures unique users exposed to your content |
|
| Impressions | Tracks total content exposure (organic + paid) |
|
|
| Audience Growth Rate | Shows whether efforts consistently attract new followers and which campaigns spike growth |
|
|
| Profile Visits | Signals audience curiosity and intent |
|
|
| Share of Voice | Benchmarks your visibility against competitors |
|
|
| Engagement | Engagement Rate | Reflects how well content resonates relative to reach |
|
| Comments & Replies | Shows emotional investment |
|
|
| Shares / Amplification Rate | Indicates organic reach potential and virality |
|
|
| Saves / Bookmarks | Highlights content with lasting reference value |
|
|
| Click-Through Rate (CTR) | Connects social effort directly to traffic and conversion goals |
|
|
| Video Views & Watch Time | Measures how well video holds attention |
|
|
| Conversions | Conversion Rate | Reveals which platforms and campaigns deliver high ROI |
|
| Social Referral Traffic | Shows how social drives traffic and helps attribute conversions |
|
|
| Cost per Conversion (CPC/CPL) | Measures cost-efficiency of paid campaigns and guides budget allocation |
|
|
| Return on Ad Spend (ROAS) | Shows revenue from paid campaigns |
|
|
| Loyalty & Sentiment | Repeat Engagement Rate | Highlights returning fans and links to retention/LTV |
|
| Sentiment Score | Gauges brand feeling and supports crisis management |
|
|
| Advanced KPIs | Response Time & Rate | Reflects attentiveness and builds trust |
|
| Content Saves and Shares (rate) | Signals lasting content value beyond likes |
|
|
| Follower Quality Index (FQI) | Ensures reporting reflects engagement |
|
|
| Post Frequency vs. Engagement Correlation | Reveals ideal posting rhythm and prevents content fatigue |
|
|
Social Media KPIs for Brand Awareness
Brand awareness is how many people are familiar with your brand. A higher brand awareness means your target audience will think of you when they are looking to buy.
1. Reach
Reach measures the number of unique users who saw your post or content during a given timeframe. If 1,200 different accounts saw your post, that’s a reach of 1,200. It differs from impressions, which count repeat views.
Social channels, like Facebook, Instagram, LinkedIn and TikTok, show reach through their built-in analytics tools.
Why it matters:
- Helps assess how effectively your social media strategy spreads brand visibility
- Allows you to compare reach across content types or platforms to see what gets seen more
- Signals when your content is failing to “break through” the algorithm filters
2. Impressions
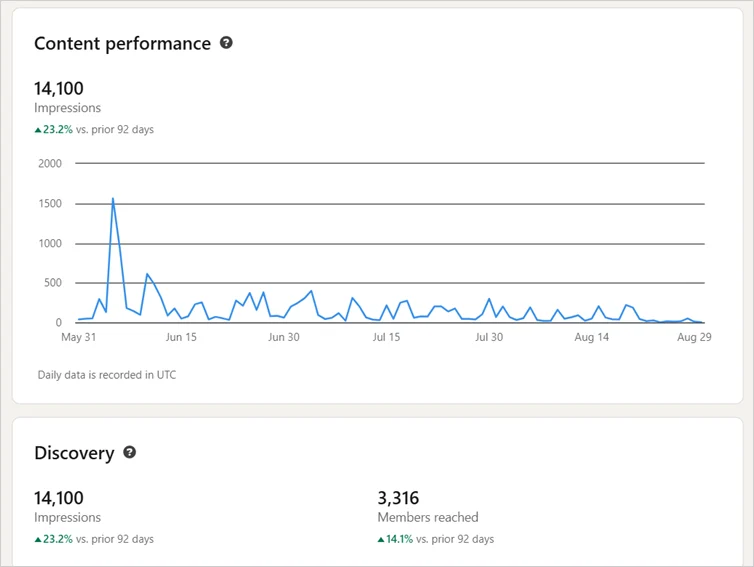
Impressions count the total number of times your content was displayed, regardless of whether the same user saw it multiple times. So, if your post appeared 3,000 times across feeds (even repeats), that’s 3,000 impressions.
Impressions help measure overall visibility and content exposure. You can view individual post impressions as well as overall impressions on major social platforms. Here’s an example of impressions as shown in LinkedIn Analytics:
Why it matters:
- Shows how often users encounter your content across platforms
- Tracks performance of both organic and paid social media campaigns
- Essential for measuring top-of-funnel brand exposure
3. Audience Growth Rate
Audience Growth Rate measures how quickly your follower count increases over time. To calculate, divide the number of new followers gained by your total audience, then multiply by 100.
Audience growth rate = (New followers gained/ Total Audience) x 100
For example, if you gained 500 followers this month and had 10,000 in total, your growth rate is 5%.
Why it matters:
- Highlights whether your social media efforts attract new followers consistently
- Detects campaign spikes that drive higher follower growth
- Helps refine targeting for specific social media platforms
4. Profile Visits
Profile visits show how many users visit your account after seeing your posts or social media ads. This KPI connects engagement to real interest in your brand.
For example, LinkedIn notifies you each time someone visits your profile. You can also check total profile visits and visitor details like the industry, job role, and location using its built-in analytics.
Why it matters:
- Shows audience curiosity and trust in your brand
- Useful for tracking social media KPIs tied to conversion intent
- Signals whether your CTAs are compelling enough to make users take action, and helps refine content
5. Share of Voice
Share of Voice (SOV) measures how often your brand is mentioned online compared to competitors. Tools like Hootsuite or Brand24 track brand mentions across multiple platforms and sources.
Why it matters:
- Indicates your brand’s visibility in ongoing online conversations
- Helps benchmark your social media performance against competitors
- Helps evaluate your brand’s position within your industry or niche
Social Media KPIs for Engagement
Engagement is a measure of the volume and depth of interaction with your social media accounts. Higher or better engagement translates to helpful, thought-provoking content that stops your audience mid-scroll.
6. Engagement Rate
Engagement rate measures how actively users interact with your social media posts through likes, comments, shares and saves relative to reach or impressions. It is calculated by dividing interactions by total impressions or reach.
Engagement rate = (Total engagements/ Total impressions or followers) x 100
For example, if a post has 100 likes, 40 comments, and 20 shares, the total engagement would be 160 engagements. And if your post has 8000 impressions, the engagement rate would be 2%.
Why it matters:
- Measures how effectively your social media posts connect with your target audience
- Can be used by social media managers to benchmark overall social media performance
- Helps improve ROI by identifying high-engagement formats
7. Comments & Replies
Comments and replies capture direct feedback and conversations happening under your content. These are often more insightful than likes because they show emotional investment.
Why it matters:
- Signals deeper audience engagement than simple reactions
- Provides qualitative insights into user sentiment and preferences
- Shows which content type sparks discussions, which can be used to refine social media strategy
8. Shares / Amplification Rate
Shares measure how often users repost or forward your content. Amplification Rate is calculated by dividing total shares by total followers, then multiplying by 100.
Amplification rate = (Total shares/ Total followers) x 100
Why it matters:
- Shows how frequently your content is shared, helping you gauge organic reach potential
- Indicates which posts are most shareable and engaging
- Tracks social media campaign virality and message resonance
9. Saves / Bookmarks
Saves measure how often users bookmark your content to revisit later. On platforms like Instagram and LinkedIn, this KPI signals lasting content value.
Why it matters:
- Highlights content formats that deliver high informational or emotional value
- Identifies long-term interests, beyond instant reactions
- Guides your social media content and posting strategy
10. Click-Through Rate (CTR)
CTR measures the percentage of users who clicked a link or CTA compared to total impressions. It applies to both organic posts and paid social media ads.
Click-through rate = (Total clicks/ Total impressions) x 100
Why it matters:
- Indicates how effective your visuals and CTAs are
- Helps track social media campaigns and conversion success
- Directly connects social media efforts to traffic and conversion goals
11. Video Views & Watch Time
This KPI tracks how many times your videos are viewed and the average duration users spend watching. Platforms like TikTok, Instagram, and YouTube provide this data in their analytics dashboards.
Why it matters:
- Measures how effectively your video content holds audience attention
- Guides future content creation and platform investment decisions
- Helps identify optimal video lengths and content types for higher social media performance
Social Media KPIs for Conversions
Conversions occur when a target audience from social media completes an action that gives business value. This can be signing up for a newsletter or purchasing a product.
12. Conversion Rate
Conversion rate measures how many users complete a desired action after engaging with your post, such as signing up, downloading or purchasing.
To calculate the conversion rate, divide conversions by clicks and multiply by 100.
Conversion rate = (Conversions / Clicks) x 100
For instance, if 50 people signed up for your webinar after 1000 users clicked your post link, your conversion rate is 5%.
Why it matters:
- Identifies which platforms and campaigns deliver the highest ROI
- Enables smarter budget allocation across marketing efforts
- Tracks progress toward measurable outcomes like leads and sales
13. Social Referral Traffic
Social Referral Traffic tracks how many users visit your website via social media links. This data is available in Google Analytics under “Acquisition” or “Traffic Acquisition Reports.”
Why it matters:
- Shows how effectively social media drives web traffic
- Helps attribute conversions to specific platforms or posts
- Improves understanding of how social channels drive on-site engagement
14. Cost per Conversion (CPC / CPL)
Cost per Conversion (or Cost per Lead) measures how much you spend to acquire one conversion from social media ads. To calculate cost per conversion, divide ad spend by the number of conversions.
Suppose you spent $500 on a social media campaign that generated 20 leads, then your cost per conversion is 500/20 = $25.
Cost per conversion = (Ad spend/ Number of conversions) x 100
Why it matters:
- Shows the cost-efficiency of your paid social media campaigns
- Guides budget optimization for higher-performing audiences
- Helps compare ROI across multiple social media platforms
15. Return on Ad Spend (ROAS)
ROAS measures how much revenue your social media ads generate for every dollar spent. It’s one of the most important social media KPIs to track when evaluating paid campaigns.
You can track ROAS using Google Analytics as well as social media advertising dashboards like Meta Ads Manager or LinkedIn Campaign Manager.
To calculate ROAS, divide revenue from ad spend by ad spend.
ROAS = Revenue from ad/ Ad spend
For example, if your paid Instagram campaign generated $4,000 in sales from $1,000 in ad spend, your ROAS is 4:1, meaning you earned $4 for every $1 spent.
Why it matters:
- Shows direct ROI from paid social media campaigns
- Determines which ad campaigns or platforms deliver the highest revenue efficiency
- Provides clarity on campaign performance across channels
Social Media KPIs for Loyalty and Sentiment
Loyalty and engagement are qualitative KPIs that evaluate the emotional health of audience relationships that go beyond volume.
16. Repeat Engagement Rate
Repeat Engagement Rate tracks how often existing followers engage with your content over time—such as recurring likes, comments, or clicks from the same users. This social media KPI focuses on retaining audience interest.
Repeat Engagement Rate = (Number of repeat interactions/ Total engagements) x 100

For instance, if 200 of your 1000 total engagements come from users who interacted more than once in a given period of time (say, a month), your repeat engagement rate is 20%.
Why it matters:
- Highlights your strongest brand advocates and returning followers
- Indicates how effectively your social media strategy builds long-term relationships
- Links directly to customer retention and lifetime value metrics
17. Sentiment Score
Sentiment Score evaluates how users feel about your brand by analyzing brand mentions across social media platforms.
Tools like Sprout Social, Brandwatch, or Hootsuite Insights automatically calculate sentiment percentages based on text and emoji usage.
Why it matters:
- Helps gauge real-time audience sentiment around campaigns or product launches
- Supports crisis management by alerting teams when negative mentions spike
- Informs brand positioning and social media strategy refinement
Bonus: 4 Advanced KPIs to Evaluate Social Media Performance
Advanced social media KPIs go beyond common funnel-focused metrics to evaluate how good the marketing strategy was and whether it is reaching the right people.
1. Response Time & Response Rate
This KPI measures how quickly and consistently your social media managers reply to comments, DMs, or mentions. It reflects how attentive your brand is to real-time interactions and customer sentiment.
Social platforms like Instagram, LinkedIn, Twitter (now X) show average response time and response rate in their built-in dashboards.
Why it matters:
- Enhances customer satisfaction and community engagement
- Builds trust and loyalty
- Provides insights into how well your team manages social media marketing efforts across platforms
2. Content Save Rate / Share Ratio
This metric measures the percentage of users who save or share your social media posts out of total impressions. It focuses on long-term content value and shareability rather than short-term likes.
To calculate your save rate, divide the total number of saves or shares by total impressions and multiply by 100.
Save rate = (Total saves/ Total impressions) x 100
Why it matters:
- Highlights posts that provide lasting value
- Improves tracking of social media KPIs tied to authentic audience engagement
- Helps identify content types that generate high community engagement and ROI
3. Follower Quality Index (FQI)
Follower Quality Index evaluates how authentic and engaged your followers are, using data like interaction rate, activity level, and repeat engagement. It helps separate meaningful followers from inactive or fake ones.
Tools like Modash or HypeAuditor can help you perform an audit across Instagram, TikTok, and other social media platforms to identify fake followers.
Why it matters:
- Ensures social media reporting reflects true engagement, not vanity metrics
- Improves campaign performance by focusing on audiences who actually interact
- Helps optimize paid ads and influencer campaigns for better social media ROI
4. Post Frequency vs. Engagement Correlation
This KPI analyzes how posting frequency affects engagement rate, impressions, and reach. It helps social media managers find the optimal posting rhythm for each platform.
To measure this KPI, track engagement rates and plot them against posting frequency. You can use dashboards like Distribution AI or Google Data Studio to visualize frequency vs. engagement trends.
Why it matters:
- Prevents content fatigue and declining engagement on social media accounts
- Reveals ideal scheduling patterns to maximize social media performance
- Guides social media strategy decisions using data-backed posting insights
How to Choose the Right Social Media KPIs in 7 Steps
It can be difficult to track all 21 metrics listed above at once, especially if you are a small team managing multiple social channels. You can use the 7-step framework below to find the top KPIs you should focus on for your next marketing campaigns.
1. Start from your business goals
Every strong social media marketing strategy begins with a clear objective. To find out yours, ask these questions:
- Do you want to increase brand awareness, generate leads, boost sales, or improve customer satisfaction?
- What are your marketing or revenue targets for the next quarter?
For example, if your business goal is to drive 20% more website traffic, your social media KPIs might focus on reach, click-through rate (CTR) and social referral traffic. Identifying the goals will surface social media campaign success metrics.
💡Keep your business goals and KPIs in sync. Social media campaigns without business alignment often deliver impressive metrics but weak ROI.
2. Define your funnel stages
Break the social media customer journey into four key phases:
- Awareness: KPIs like reach, impressions, and audience growth rate show how many users discover your brand.
- Engagement: Track engagement rate, shares, comments, and saves to understand how users interact with your content.
- Conversion: Measure conversion rate, CTR, and ROAS to connect your campaigns to revenue.
- Loyalty: Use sentiment score and repeat engagement rate to gauge customer trust and retention.
For instance, a skincare business may use reach and impressions to measure awareness from influencer campaigns, then monitor conversion rate and ROAS for product launch success. Note that each funnel stage should be tied to overall business outcomes.
3. Choose 1–2 KPIs per stage
Pick only a few important social media KPIs that reflect progress for each funnel stage, so you can track them effectively without getting overwhelmed.
Example:
- For awareness, focus on reach and audience growth rate.
- For engagement, choose engagement rate and amplification rate.
- For conversion, use conversion rate and social media ROI.
- For loyalty, stick to sentiment score and customer feedback.
Tracking too many metrics creates confusion, especially if all the metrics don’t connect to current social media goals.
4. Use baselines and benchmarks
To measure performance, you need a reference point. Start by reviewing your social media analytics or historical reports to understand your current position.
For example, if your average engagement rate on Instagram is 2%, use that as your baseline.
Then, compare your results to industry benchmarks. You can use tools like Sprout Social, Rival IQ, or Hootsuite to publish benchmark reports by platform and industry.
5. Set numeric targets and timelines
Once you’ve chosen your KPIs, translate them into measurable goals with deadlines. For instance:
- Increase engagement rate from 2% to 3.5% in 60 days
- Grow audience reach by 15% in the next quarter
- Reduce cost per conversion by 10% through better targeting
Quantifying your targets helps you track social media KPIs with clarity. It also gives your team a measurable success point rather than vague growth goals.
6. Assign responsibility and reporting cadence
Decide who tracks what and how often. This ensures accountability and consistency. For example, let the content lead track engagement KPIs weekly, or the marketing head review all social media dashboards quarterly for strategic adjustments.
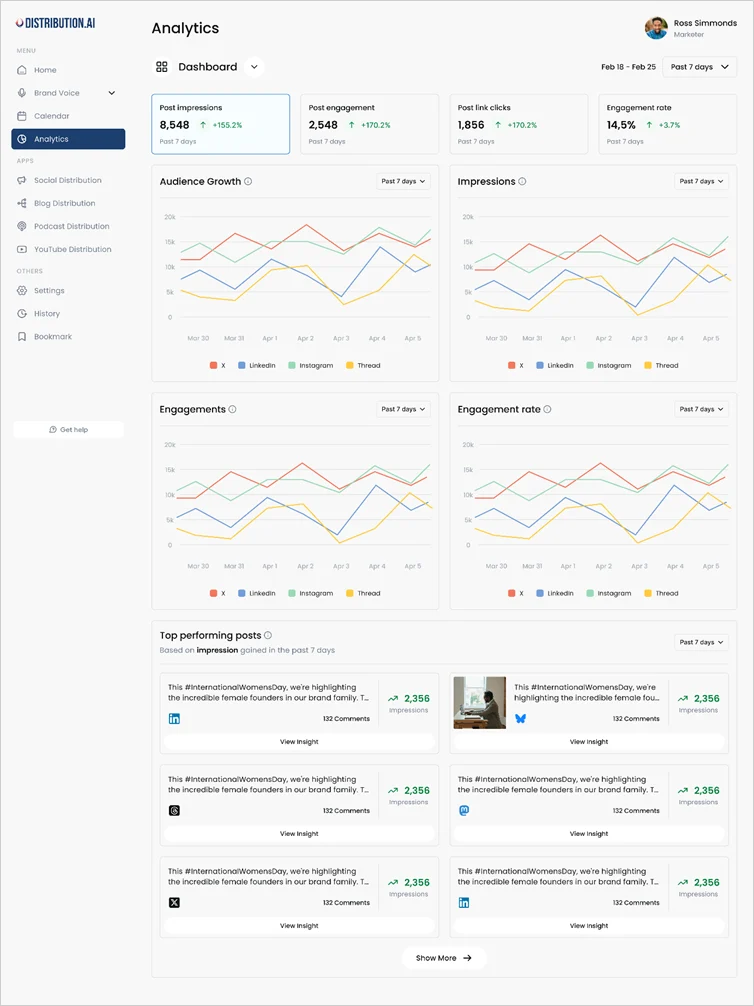
You can look at the built-in analytics dashboards of each social media platform. However, it can be hectic as you will be cycling through multiple tools to track KPIs.
A better alternative is to use Distribution.ai, where you can monitor social media KPIs on top of creating and scheduling posts.
7. Review and refine regularly
As your social media strategy evolves, so should your metrics. For example, when launching a new product, awareness KPIs might dominate. Once the product gains traction, shift focus toward engagement and conversion. If your social media ROI is solid but engagement is dipping, it might be time to test new formats or social media channels.
Continuous optimization keeps your KPI tracking relevant and ensures you’re always measuring what matters most for your business objectives.
4 Best Practices to Track Social Media KPIs Smarter
Now that you know what to track and why, it is essential to learn how to analyze a particular social media KPI to draw meaningful and actionable insights for your business.
- Use rolling averages for accuracy: Calculate 7- or 30-day averages to see true social media performance trends. This helps avoid false positives from viral outliers.
- Segment KPIs by audience and content type: Track engagement rate or reach by content category (videos, carousels, polls) and audience group (new vs. existing). It allows you to scale up/down certain formats and themes.
- Pair organic and paid results: Boost your best-performing organic posts further through paid campaigns. These are content pieces that already are a hit among your audience.
- Audit follower quality regularly: A sudden follower surge could be from bots or irrelevant accounts. Use tools like HypeAuditor or your social media dashboard to check authenticity and clean up inactive followers.
Common Mistakes When Tracking Social Media KPIs
Sometimes you may get carried away when you see the face value of a metric. Below are four such oversights and what you should do in such scenarios when measuring social media ROI:
- Reporting without context: A spike or drop needs to be connected to marketing action and niche trends.
- Ignoring platform differences: Each social media platform measures engagement differently, so comparing Instagram saves with LinkedIn clicks may give you the wrong idea. Instead, benchmark each metric for every platform for your industry.
- Chasing virality: Some content pieces may go viral, but they are often a product of consistency. Additionally, it is challenging to plan viral posts.
- Neglecting retention metrics: The audience that sticks around is more likely to buy from you because you can nudge them forward in your social media funnel.
Improve Your Social Media KPIs with Distribution.ai
Each social media KPI can be directly or indirectly improved with content. However, busy teams may not be able to dedicate several hours every week to writing posts, coming up with captions, clipping videos and creating threads.
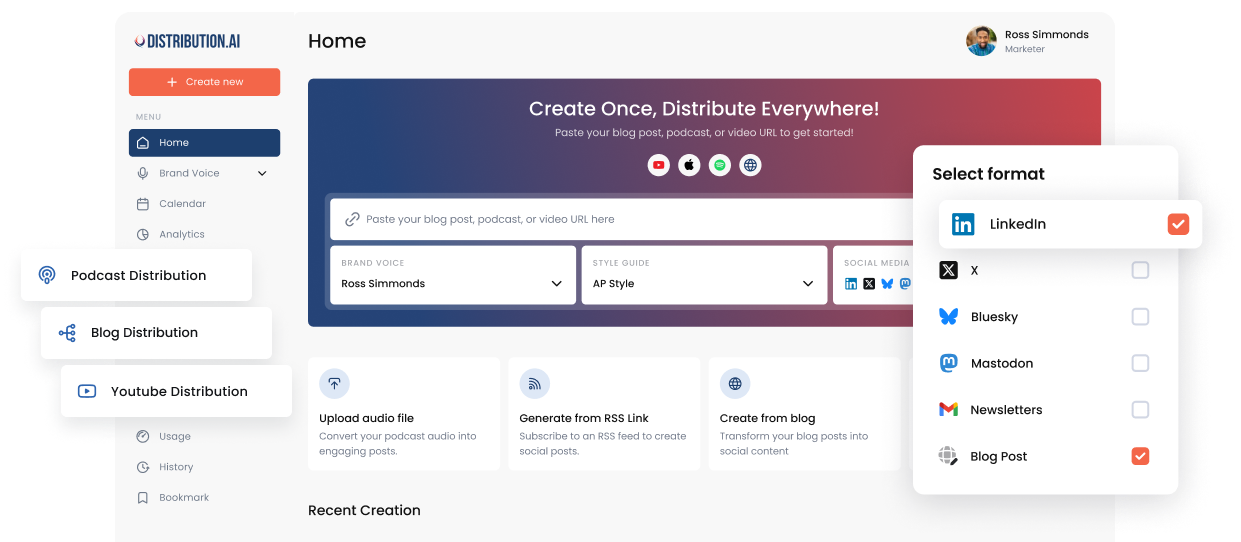
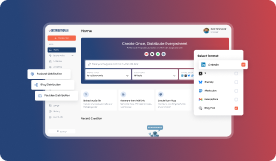
Distribution.ai helps with that by converting an existing piece of long-form content into multiple channel-native social media posts.
For instance, you can paste the link to an existing YouTube video or a published blog article. In under a minute, the platform will produce multiple short-form content pieces in various formats.
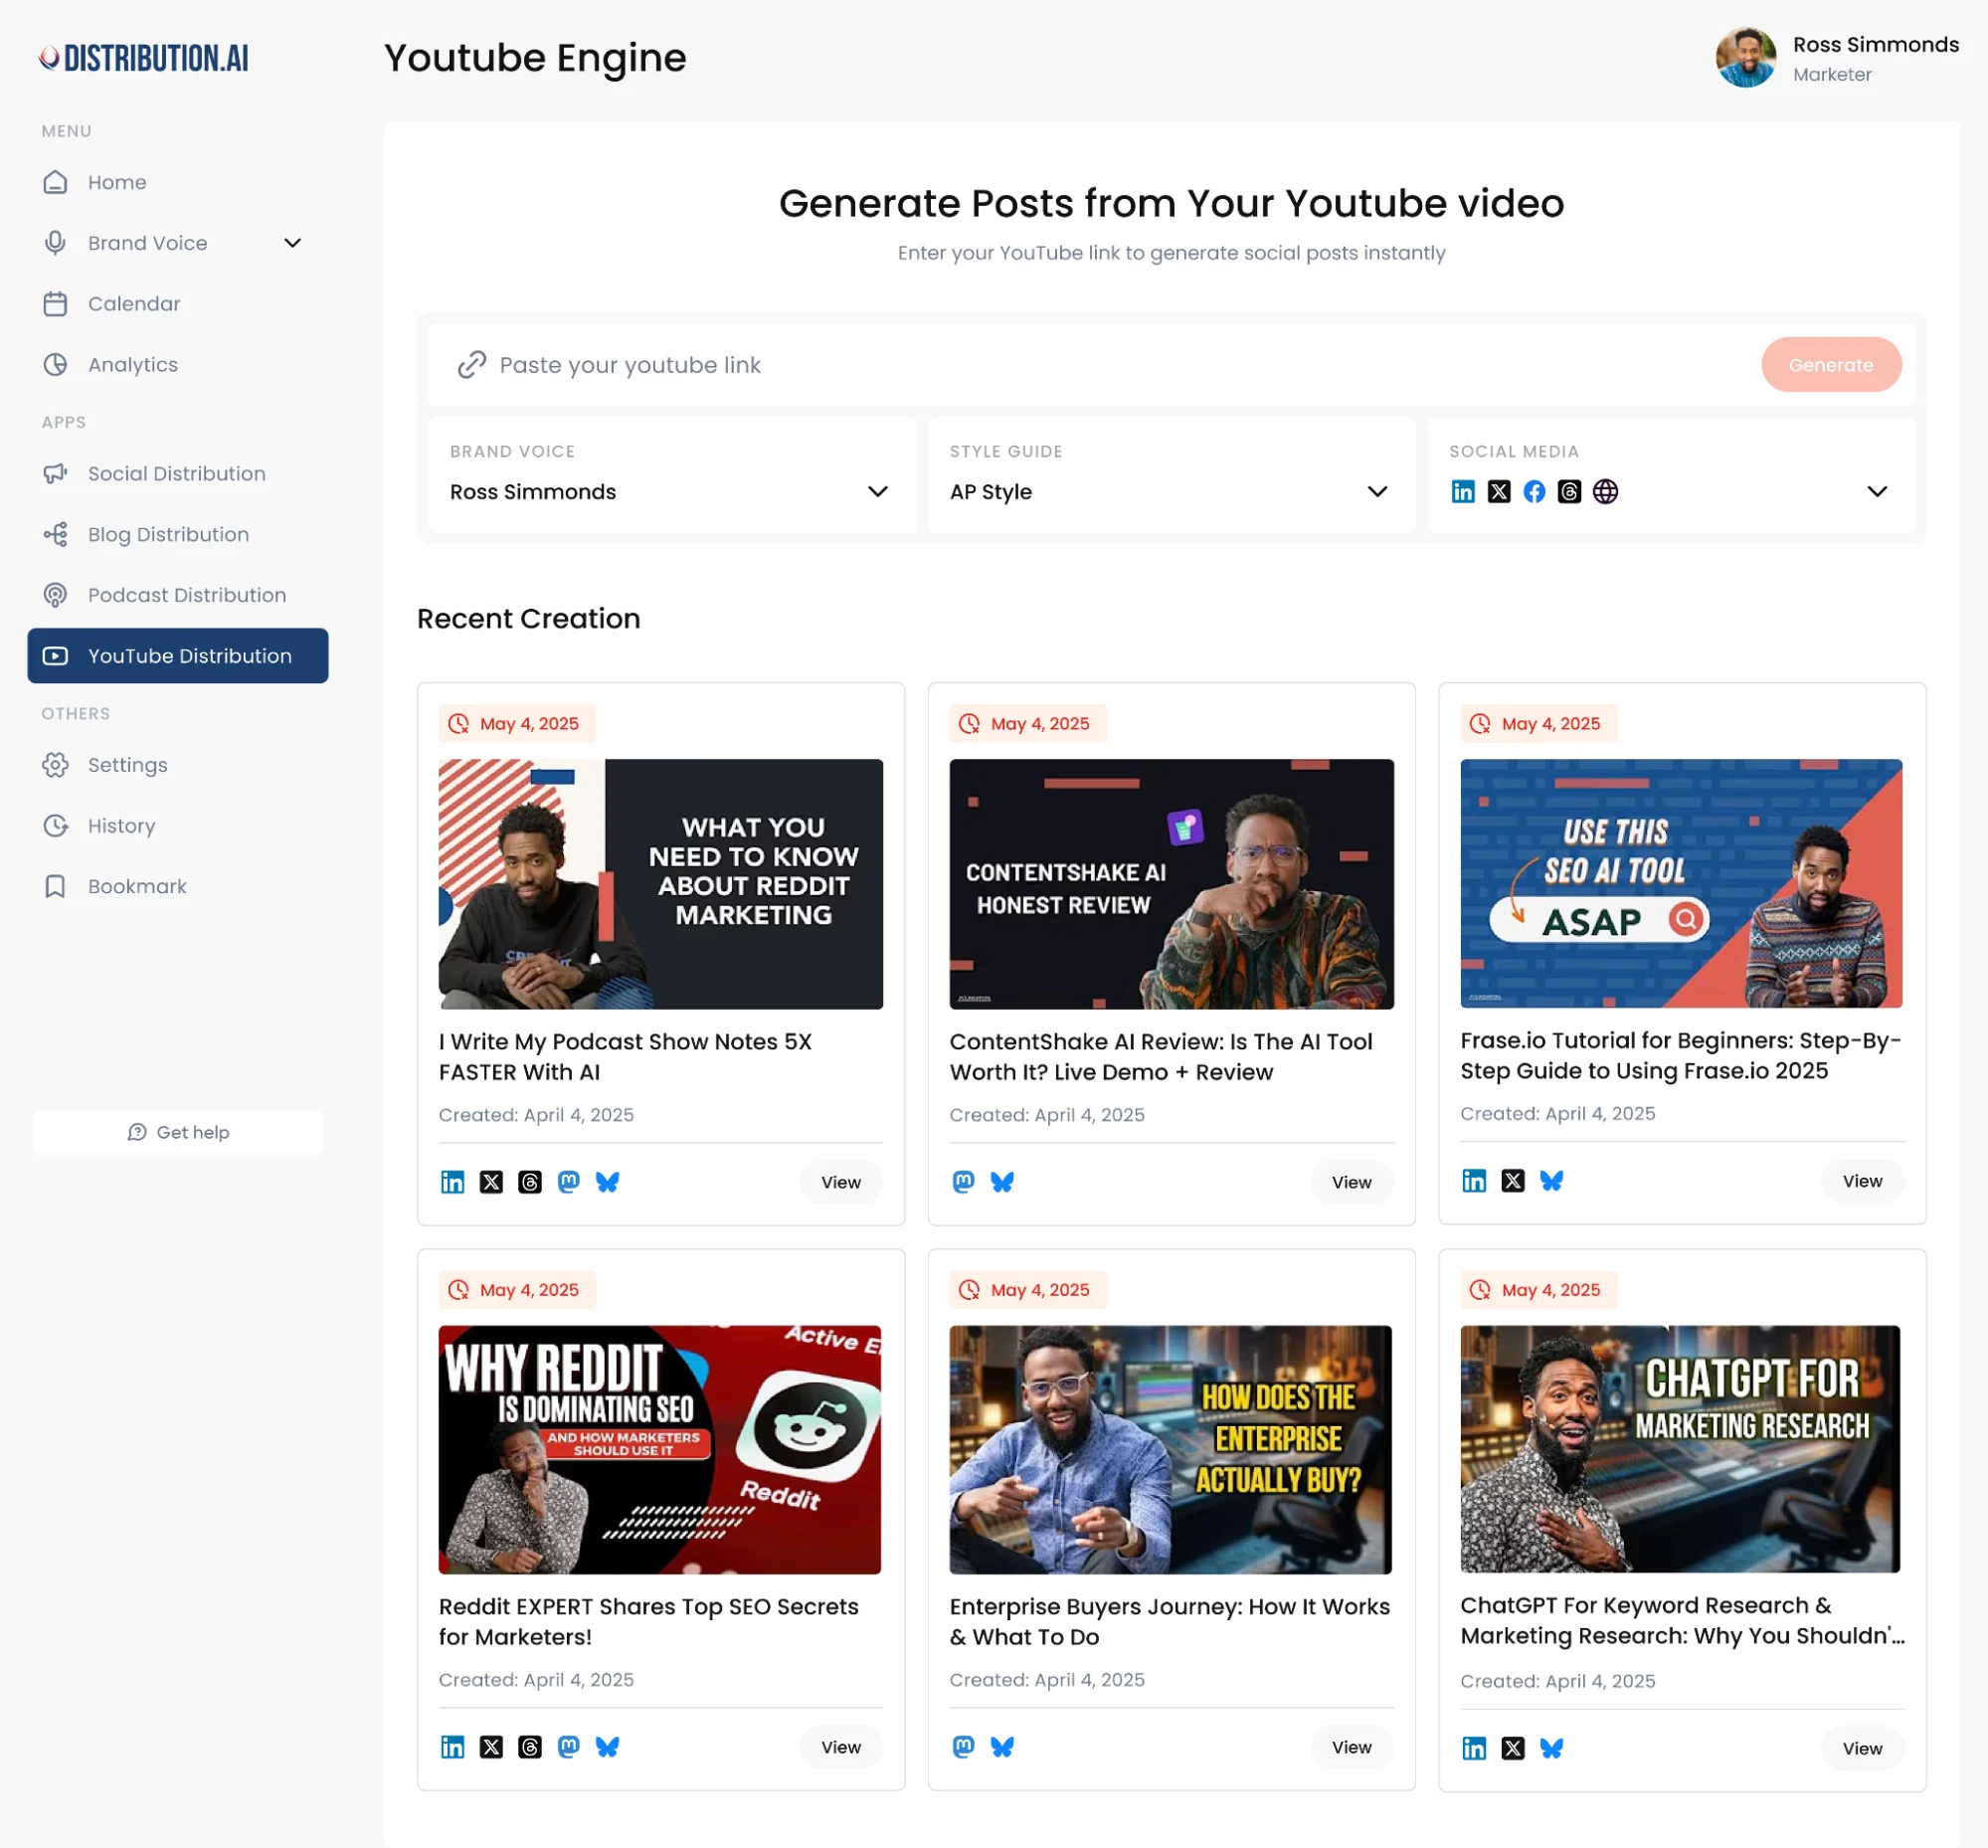
You can use it to extract viral-worthy moments from podcasts and key takeaways from an in-depth industry report for different channels like LinkedIn, X, Instagram, YouTube, Mastodon and Bluesky.
Additionally, you can schedule each post for publication without leaving the platform and track its performance in the unified dashboard.
Frequently Asked Questions
What Are the Most Important KPIs for Social Media?
The most important KPIs, generally, are impressions, engagement, click-through rates and conversions. At the same time, it is essential to consider your social media marketing goals to identify the important metrics relevant to your business.
What Are Social Media KPIs?
Social media KPIs are quantifiable and measurable metrics that help you track the ROI of your marketing efforts and identify areas for improvement in your content strategy. Some important social media KPIs in digital marketing are impressions, engagement, click-through rates, conversions and brand sentiment.
How Do You Measure KPIs in Social Media?
Each social media channel shows KPIs in its built-in dashboard. It can be better to use a unified reporting tool like Distribution.ai to save time. You may also need specialized tools like Google Analytics and Brandwatch to track advanced metrics like conversions and audience sentiment.
How to Measure Social Media Engagement?
Social media engagement can be tracked by monitoring likes, comments, DMs, saves and shares. Beyond the numbers, it’s also important to look at the quality of engagement and who it is coming from. Ideally, you want comments and DMs that are thought-through and from your potential buyers.
Promote, repurpose & distribute your content with AI
Write 10x faster, engage your audience, & never struggle with the blank page again.
Start 15-Day Free Trial
Frequently Asked Questions
Author

Promote, repurpose & distribute your content with AI
Start 15-Day Free Trial