15+ Social Media KPIs Every Marketer Should Track [Expert Tips Inside]
Discover 15+ essential social media KPIs, how to set them, and expert-backed tips that help you measure business performance, ROI, and growth effectively.
Social media used to feel straightforward. You just had to post consistently, watch the likes roll in, and assume your strategy was working.
But, that doesn’t fly anymore.
Algorithms change constantly, attention spans are shorter, and organic reach keeps shrinking. Now, social media success isn’t about posting more; it’s about knowing what actually drives results.
That’s where social media KPIs make the difference. They show what’s resonating, what’s wasting effort, and where your next big opportunity really lies. In this post, we’ll walk you through the must-track social media KPIs and some expert tips on KPI tracking.
What are Social Media KPIs?
Social media KPIs (Key Performance Indicators) are the core metrics used to measure whether your social media efforts are driving impact. Tracking KPIs helps understand how your social media marketing strategies are contributing to real outcomes. In other words, social media KPIs are tied directly to your business goals (awareness, engagement, conversions) that help you measure business impact, not just visibility.
How to Set Social Media KPIs?
Here’s a step-by-step way to set effective key performance indicators (KPIs) that reflect impact:
1. Start from your business goals
Every strong social media marketing strategy begins with a clear objective. Consider these:
- Do you want to increase brand awareness, generate leads, boost sales, or improve customer satisfaction?
- What are your marketing or revenue targets for the next quarter?
For example, if your business goal is to drive 20% more website traffic, your social media KPIs might focus on reach, click-through rate (CTR), and social referral traffic.
💡Pro tip: Keep your business goals and KPIs in sync. Social media campaigns without business alignment often deliver impressive metrics but weak ROI.
2. Define your funnel stages
Social media supports every part of the marketing funnel—from first impressions to long-term retention. Break your strategy into four key phases:
- Awareness: KPIs like reach, impressions, and audience growth rate show how many users discover your brand.
- Engagement: Track engagement rate, shares, comments, and saves to understand how users interact with your content.
- Conversion: Measure conversion rate, CTR, and ROAS to connect your campaigns to revenue.
- Loyalty: Use sentiment score and repeat engagement rate to gauge customer trust and retention.
For instance, a skincare business may use reach and impressions to measure awareness from influencer campaigns, then monitor conversion rate and ROAS for product launch success.
3. Choose 1–2 KPIs per stage
Start small. Select a few important social media KPIs that reflect progress for each funnel stage.
Example:
- For awareness, focus on reach and audience growth rate.
- For engagement, choose engagement rate and amplification rate.
- For conversion, use conversion rate and social media ROI.
- For loyalty, stick to sentiment score and customer feedback.
Tracking too many metrics creates confusion, especially if all the metrics don’t connect to outcomes.
4. Use baselines and benchmarks
To measure performance, you need a reference point. Start by reviewing your social media analytics or historical reports to understand your current position.
For example, if your average engagement rate on Instagram is 2%, use that as your baseline.
Then, compare your results to industry benchmarks. You can use tools like Sprout Social, Rival IQ, or Hootsuite to publish benchmark reports by platform and industry.
5. Set numeric targets and timelines
Once you’ve chosen your KPIs, translate them into measurable goals with deadlines. For instance:
- Increase engagement rate from 2% to 3.5% in 60 days
- Grow audience reach by 15% in the next quarter
- Reduce cost per conversion by 10% through better targeting
Quantifying your targets helps you track social media KPIs with clarity. It also gives your team a measurable success point rather than vague growth goals.
6. Assign responsibility and reporting cadence
Decide who tracks what and how often. This ensures accountability and consistency. For example, let the content lead track engagement KPIs weekly, or the marketing head review all social media dashboards quarterly for strategic adjustments.
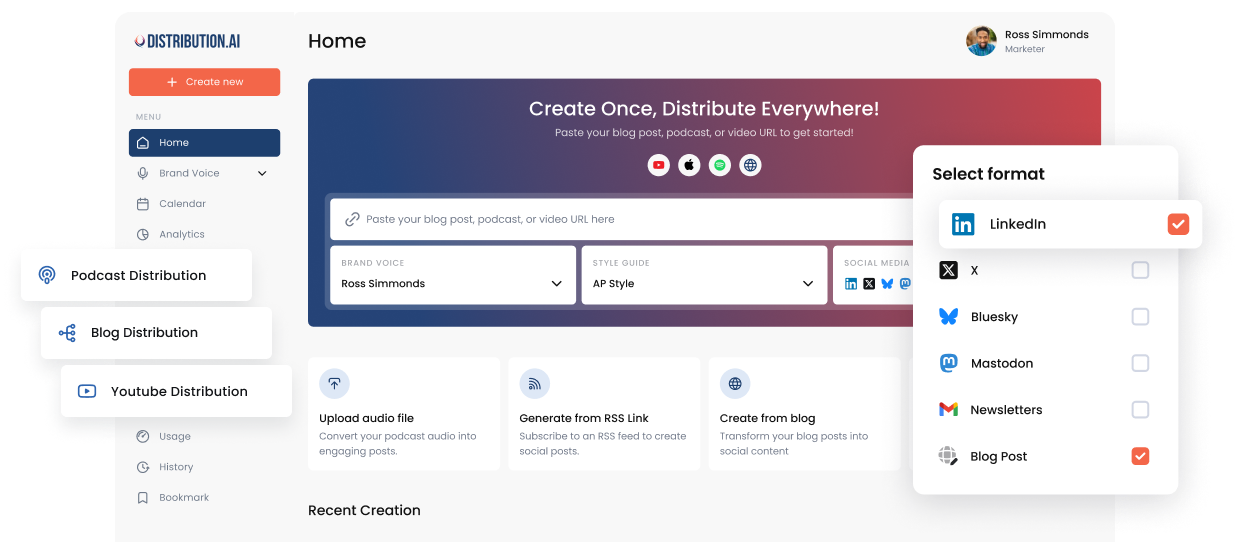
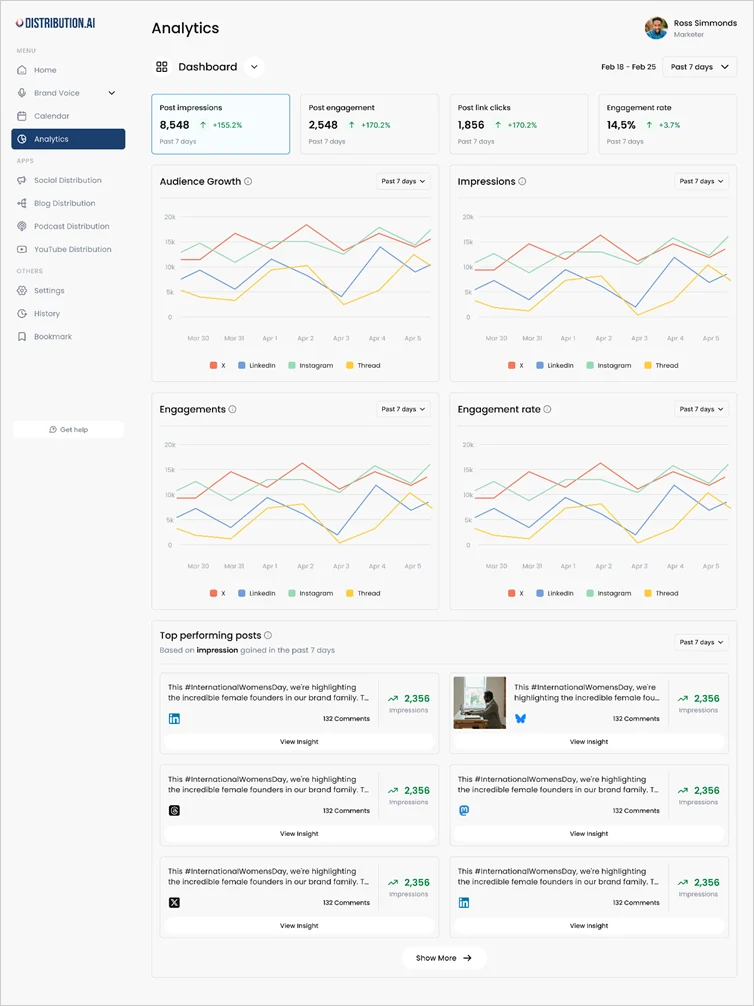
You can use built-in analytics tools like Meta Business Suite, LinkedIn Analytics, or third-party automated reporting tools like Distribution AI to view all your KPIs in a single dashboard.
7. Review and refine regularly
As your social media strategy evolves, so should your metrics. For example, when launching a new product, awareness KPIs might dominate. Once the product gains traction, shift focus toward engagement and conversion. If your social media ROI is solid but engagement is dipping, it might be time to test new formats or social media channels.
Continuous optimization keeps your KPI tracking relevant and ensures you’re always measuring what matters most for your business objectives.
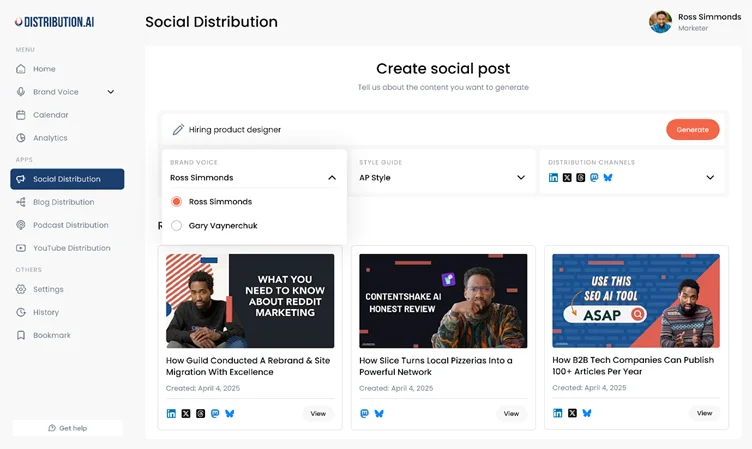
Tools like Distribution AI let you A/B test multiple social copies, images, and captions so you can identify which version performs the best. This helps you test your campaigns and posts to ensure consistent engagement.
Now that you know how to set social media KPIs, let’s look at the KPIs you should track.
15 Essential Social Media KPIs
Social Media KPIs for Brand Awareness
1. Reach
Reach measures the number of unique users who saw your post or content during a given timeframe. If 1,200 different accounts saw your post, that’s a reach of 1,200. It differs from impressions, which count repeat views.
Most major social channels, like Facebook, Instagram, LinkedIn, and TikTok show reach through their built-in analytics tools.
Why it matters:
- Helps assess how effectively your social media strategy spreads brand visibility
- Allows you to compare reach across content types or platforms to see what gets seen more
- Signals when your content is failing to “break through” the algorithm filters
2. Impressions
Impressions count the total number of times your content was displayed, regardless of whether the same user saw it multiple times. So, if your post appeared 3,000 times across feeds (even repeats), that’s 3,000 impressions.
Impressions help measure overall visibility and content exposure. You can view individual post impressions as well as overall impressions on major social platforms. Here’s an example of impressions as shown in LinkedIn Analytics:
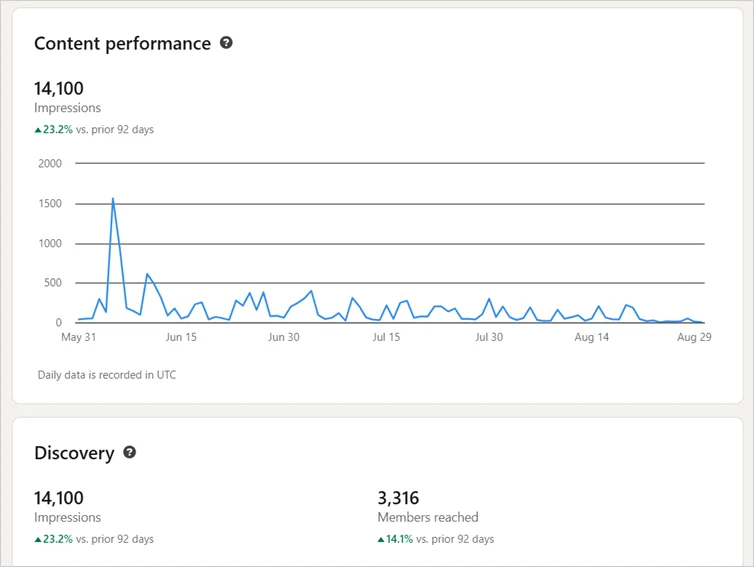
Why it matters:
- Shows how often users encounter your content across platforms
- Tracks performance of both organic and paid social media campaigns
- Essential for measuring top-of-funnel brand exposure
3. Audience Growth Rate
Audience Growth Rate measures how quickly your follower count increases over time. To calculate, divide the number of new followers gained by your total audience, then multiply by 100. For example, if you gained 500 followers this month and had 10,000 in total, your growth rate is 5%.
Audience growth rate = (New followers gained/ Total Audience) x 100
Why it matters:
- Highlights whether your social media efforts attract new followers consistently
- Detects campaign spikes that drive higher follower growth
- Helps refine targeting for specific social media platforms
4. Profile Visits
Profile visits show how many users visit your account after seeing your posts or social media ads. This KPI connects engagement to real interest in your brand.
For example, LinkedIn notifies you each time someone visits your profile. You can also check total profile visits and visitor details like the industry, job role, and location using its built-in analytics.
Why it matters:
- Shows audience curiosity and trust in your brand
- Useful for tracking social media KPIs tied to conversion intent
- Signals whether your CTAs are compelling enough to make users take action, and helps refine content
5. Share of Voice
Share of Voice (SOV) measures how often your brand is mentioned online compared to competitors. Tools like Hootsuite or Brand24 track brand mentions across multiple platforms and sources.
Why it matters:
- Indicates your brand’s visibility in ongoing online conversations
- Helps benchmark your social media performance against competitors
- Helps evaluate your brand’s position within your industry or niche
Social Media KPIs for Engagement
6. Engagement Rate
Engagement rate measures how actively users interact with your social media posts — likes, comments, shares, and saves relative to reach or impressions. It is calculated by dividing interactions by total impressions or reach.
Engagement rate = (Total engagements/ Total impressions or followers) x 100
For example, if a post has 100 likes, 40 comments, and 20 shares, the total engagement would be 160 engagements. And if your post has 8000 impressions, the engagement rate would be 2%.
Why it matters:
- Measures how effectively your social media posts connect with your target audience
- Can be used by social media managers to benchmark overall social media performance
- Helps improve ROI by identifying high-engagement formats
7. Comments & Replies
Comments and replies capture direct feedback and conversations happening under your content. These are often more insightful than likes because they show emotional investment.
Why it matters:
- Signals deeper audience engagement than simple reactions
- Provides qualitative insights into user sentiment and preferences
- Shows which content type sparks discussions, which can be used to refine social media strategy
8. Shares / Amplification Rate
Shares measure how often users repost or forward your content. Amplification Rate is calculated by dividing total shares by total followers, then multiplying by 100.
Amplification rate = (Total shares/ Total followers) x 100
Why it matters:
- Shows how frequently your content is shared, helping you gauge organic reach potential
- Indicates which posts are most shareable and engaging
- Tracks social media campaign virality and message resonance
9. Saves / Bookmarks
Saves measure how often users bookmark your content to revisit later. On platforms like Instagram and LinkedIn, this KPI signals lasting content value.
Why it matters:
- Highlights content formats that deliver high informational or emotional value
- Identifies long-term interests, beyond instant reactions
- Guides your social media content and posting strategy
10. Click-Through Rate (CTR)
CTR measures the percentage of users who clicked a link or CTA compared to total impressions. It applies to both organic posts and paid social media ads.
Click-through rate = (Total clicks/ Total impressions) x 100
Why it matters:
- Indicates how effective your visuals and CTAs are
- Helps track social media campaigns and conversion success
- Directly connects social media efforts to traffic and conversion goals
11. Video Views & Watch Time
This KPI tracks how many times your videos are viewed and the average duration users spend watching. Platforms like TikTok, Instagram, and YouTube provide this data in their analytics dashboards.
Why it matters:
- Measures how effectively your video content holds audience attention
- Guides future content creation and platform investment decisions
- Helps identify optimal video lengths and content types for higher social media performance
Social Media KPIs for Conversions
12. Conversion Rate
Conversion Rate measures how many users complete a desired action after engaging with your post — such as signing up, downloading, or purchasing. To calculate the conversion rate, divide conversions by clicks. For instance, if 50 people signed up for your webinar after 1000 users clicked your post link, your conversion rate is 5%.
Conversion rate = (Conversions / Clicks) x 100
Why it matters:
- Identifies which platforms and campaigns deliver the highest ROI
- Enables smarter budget allocation across marketing efforts
- Tracks progress toward measurable outcomes like leads and sales
13. Social Referral Traffic
Social Referral Traffic tracks how many users visit your website via social media links. This data is available in Google Analytics under “Acquisition” or “Traffic Acquisition Reports.”
Why it matters:
- Shows how effectively social media drives web traffic
- Helps attribute conversions to specific platforms or posts
- Improves understanding of how social channels drive on-site engagement
14. Cost per Conversion (CPC / CPL)
Cost per Conversion (or Cost per Lead) measures how much you spend to acquire one conversion from social media ads. To calculate cost per conversion, divide ad spend by the number of conversions.
Suppose you spent $500 on a social media campaign that generated 20 leads, then your cost per conversion is 500/20 = $25.
Cost per conversion = (Ad spend/ Number of conversions) x 100
Why it matters:
- Shows the cost-efficiency of your paid social media campaigns
- Guides budget optimization for higher-performing audiences
- Helps compare ROI across multiple social media platforms
15. Return on Ad Spend (ROAS)
ROAS measures how much revenue your social media ads generate for every dollar spent. It’s one of the most important social media KPIs to track when evaluating paid campaigns. You can track ROAS using Google Analytics as well as social media advertising dashboards like Meta Ads Manager or LinkedIn Campaign Manager.
To calculate ROAS, divide revenue from ad spend by ad spend. For example, if your paid Instagram campaign generated $4,000 in sales from $1,000 in ad spend, your ROAS is 4:1, meaning you earned $4 for every $1 spent.
ROAS = Revenue from ad/ Ad spend
Why it matters:
- Shows direct ROI from paid social media campaigns
- Determines which ad campaigns or platforms deliver the highest revenue efficiency
- Provides clarity on campaign performance across channels
Social Media KPIs for Loyalty and Sentiment
16. Repeat Engagement Rate
Repeat Engagement Rate tracks how often existing followers engage with your content over time—such as recurring likes, comments, or clicks from the same users. This social media KPI focuses on retaining audience interest.
For instance, if 200 of your 1000 total engagements come from users who interacted more than once in a given period of time (say, a month), your repeat engagement rate is 20%.
Repeat Engagement Rate = (Number of repeat interactions/ Total engagements) x 100
Why it matters:
- Highlights your strongest brand advocates and returning followers
- Indicates how effectively your social media strategy builds long-term relationships
- Links directly to customer retention and lifetime value metrics
17. Sentiment Score
Sentiment Score evaluates how users feel about your brand by analyzing positive, neutral, and negative brand mentions across social media platforms. Tools like Sprout Social, Brandwatch, or Hootsuite Insights automatically calculate sentiment percentages based on text and emoji usage.
Why it matters:
- Helps gauge real-time audience sentiment around campaigns or product launches
- Supports crisis management by alerting teams when negative mentions spike
- Informs brand positioning and social media strategy refinement
Bonus: 5 Advanced Social Media KPIs
1. Hashtag Performance
Hashtag performance tracks how specific hashtags contribute to reach, impressions, and engagement across multiple social media platforms. It helps you evaluate which hashtags amplify visibility and attract the right audience for your campaigns.
To track hashtag performance, you can use tools like Keyhole, Brand24, or Rival IQ. Additionally, you can use social listening tools for tracking brand mentions, hashtag trends, and sentiment analysis.
Why it matters:
- Identifies hashtags that drive higher engagement and discovery in social media campaigns
- Optimizes your content strategy for different social media platforms and target audiences
- Helps improve social media performance by avoiding overused or low-impact tags
2. Response Time & Response Rate
This KPI measures how quickly and consistently your social media managers reply to comments, DMs, or mentions. It reflects how attentive your brand is to real-time interactions and customer sentiment.
Most social platforms like Instagram, LinkedIn, Twitter (now X) show average response time and response rate in their built-in dashboards.
Why it matters:
- Enhances customer satisfaction and community engagement
- Builds trust and loyalty
- Provides insights into how well your team manages social media marketing efforts across platforms
3. Content Save Rate / Share Ratio
This metric measures the percentage of users who save or share your social media posts out of total impressions. It focuses on long-term content value and shareability rather than short-term likes.
To calculate your save rate, divide the total number of saves or shares by total impressions and multiply by 100.
Save rate = (Total saves/ Total impressions) x 100
Why it matters:
- Highlights posts that provide lasting value
- Improves tracking of social media KPIs tied to authentic audience engagement
- Helps identify content types that generate high community engagement and ROI
4. Follower Quality Index (FQI)
Follower Quality Index evaluates how authentic and engaged your followers are, using data like interaction rate, activity level, and repeat engagement. It helps separate meaningful followers from inactive or fake ones.
Tools like Modash or HypeAuditor can help you perform an audit across Instagram, TikTok, and other social media platforms to identify fake followers.
Why it matters:
- Ensures social media reporting reflects true engagement, not vanity metrics
- Improves campaign performance by focusing on audiences who actually interact
- Helps optimize paid ads and influencer campaigns for better social media ROI
5. Post Frequency vs. Engagement Correlation
This KPI analyzes how posting frequency affects engagement rate, impressions, and reach. It helps social media managers find the optimal posting rhythm for each platform.
To measure this KPI, track engagement rates and plot them against posting frequency. You can use dashboards like Distribution AI or Google Data Studio to visualize frequency vs. engagement trends.
Why it matters:
- Prevents content fatigue and declining engagement on social media accounts
- Reveals ideal scheduling patterns to maximize social media performance
- Guides social media strategy decisions using data-backed posting insights
Common Mistakes When Tracking Social Media KPIs
- Confusing metrics with KPIs. Not every number is a KPI. KPIs should link directly to your business goals—not vanity metrics such as likes or follower count.
- Reporting without context. A spike or drop means nothing if you can’t explain why. Always connect results to campaigns, timing, or content or trend changes.
- Ignoring platform differences. Each social media platform measures engagement differently. Don’t compare Instagram saves with LinkedIn clicks—use benchmarks unique to each channel.
- Tracking short-term wins only. Many marketers chase one viral post but ignore consistency. Sustainable performance comes from tracking patterns over months and continuously optimizing.
- Neglecting retention metrics. Engagement isn’t everything. If repeat engagement or sentiment drops, it signals your audience isn’t sticking around. This impacts your long-term business goals.
5 Expert Tips to Track Social Media KPIs Smarter
- Use rolling averages for accuracy: Instead of reacting to one-day spikes, calculate 7- or 30-day averages to see true social media performance trends. This helps avoid false positives from viral outliers.
- Segment KPIs by audience and content type: Track engagement rate or reach by content category (videos, carousels, polls) and audience group (new vs. loyal). It reveals which formats drive deeper user engagement.
- Measure frequency, not just reach: If the same user sees your post five times, frequency may be too high, leading to fatigue. Tracking how many social media users repeatedly see your content helps balance visibility without overexposure.
- Pair organic and paid results: Boost your best-performing organic posts and compare outcomes. This shows how paid ads amplify engagement and whether your marketing campaign ROI justifies ad spend.
- Audit follower quality regularly: A sudden follower surge could be from bots or irrelevant accounts. Use tools like HypeAuditor or your social media dashboard to check authenticity and clean up inactive followers.
Track the Right KPIs to Measure Business Impact
You don’t need another social media platform or a new posting formula if your current strategy isn’t working. You need clarity on what’s driving results and what’s not.
The right social media KPIs identify where you need to improve and guide your decision-making. They show you which posts build connection, which ads drive conversions, and which efforts deserve your budget.
However, native analytics don’t provide the in-depth view you need to refine your strategies. That’s where tools like Distribution AI come in. Along with repurposing your existing content, scheduling, and publishing it, it also gives you detailed analytics on engagement, click-through rates, top-performing posts, and more. It simplifies tracking and keeps your social media content strategy moving.
Frequently Asked Questions
What is a KPI in social media?
A KPI (Key Performance Indicator) in social media is a measurable metric that tracks how well your content or campaigns perform against your business goals. For example, engagement rate, reach, or conversion rate are all social media KPIs that help you understand if your marketing efforts are paying off.
What is the 70/20/10 rule for social media?
The 70/20/10 rule helps balance your content mix. 70% of posts should be valuable and educational, 20% can be curated or shared from others, 10% should directly promote your business. This mix keeps your feed engaging while still driving conversions from potential customers.
What are the 7 C’s of social media?
The 7 C’s are guiding principles for effective social media management: Content, Community, Conversation, Consistency, Credibility, Creativity, and Conversion. Together, they help brands stay authentic while building trust and engagement across platforms.
What is the 50/30/20 rule for social media?
The 50/30/20 rule in social media is a content mix strategy. It suggests dividing your content into three categories to maintain balance and engagement: 50% of your posts should focus on valuable, educational, or entertaining content that builds trust and authority; 30% should center on community engagement and curated content that encourages conversation and connection; and the remaining 20% should highlight promotional or experimental posts such as offers, product updates, or ad campaigns.
Which KPIs demonstrate social media ROI?
To measure social media ROI, tracking performance metrics and KPIs that show business impact include conversion rate, Cost Per Conversion (CPC), Return on Ad Spend (ROAS), sales revenue from social media These reveal whether your campaigns are generating measurable returns.
What are the best KPIs on Instagram?
Some of the top social media KPIs for Instagram are: Engagement rate (likes, comments, shares, saves), Reach and impressions, Follower growth rate, Story completion rate, Profile visits (available on business accounts) and website clicks. These key metrics show how users interact with your brand on the platform.
What are the most important social media KPIs?
The most important social media KPIs depend on your goal, but in general, reach and impressions are for tracking awareness, engagement rates indicate audience interest, conversion rates hint at ROI, and repeat engagement rate indicate customer loyalty. Tracking them all cover every stage of your social media funnel.
How to measure social media goals?
Start by defining your business goals, then map each to a KPI. Use built-in analytics tools (like Meta Insights or LinkedIn Analytics) or third-party tools (like Distribution AI) to track progress. Then, review results monthly and adjust your social media marketing strategy based on trends.
Promote, repurpose & distribute your content with AI
Write 10x faster, engage your audience, & never struggle with the blank page again.
Start 15-Day Free TrialFrequently Asked Questions
Author
Promote, repurpose & distribute your content with AI
Start 15-Day Free Trial